EXTRASOLAR PLANET TrES-1 TRANSIT OBSERVATIONS
Updated 31 Dec 2004 - anomalous egress seen in pooled data
Detection of a
Jupiter sized planet TrES-1b orbiting star GSC 2652-1324 with a period of 3.03 days was confirmed by profesional astronomers on 24th August 2004 and confirmed in amateur measurements made of the planet transits on 1st and 4th September. On 7th September, I made a series of measurements of this object using a modified webcam.

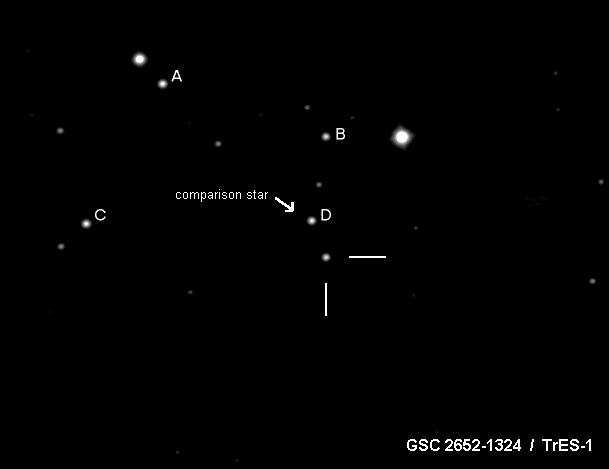
VC200L @ f7 VESTA SC3 B+W WEBCAM 291x 6sec
Field 12x9 arcmin North is up
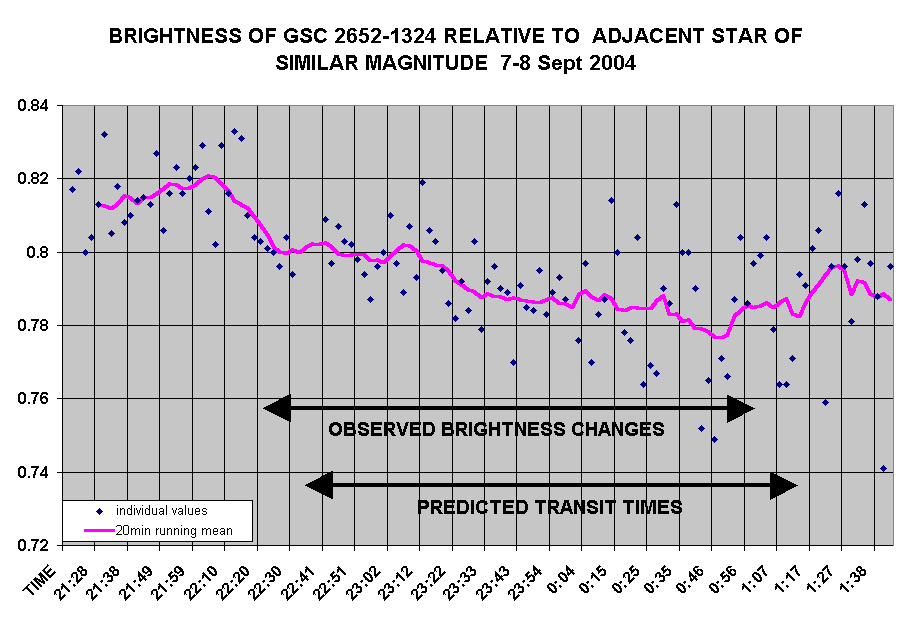
A continuous series of images were recorded using a Vesta B+W SC3 modified webcam and 8 inch Vixen VC200L Cassegrain telescope at f7 and measurements of the comparative brightness of the 11.5 mag host star were made.
Each data point represents a comparative brightness measurement of GSC 2652-1324 relative to an adjacent star of similar magnitude. Each measured image was an average of 20x 6 second exposures. IRIS software was used to measure the integrated brightnesses.
Although the data is noisy and a downward drift can be seen in the measurements during the run, a drop and rise in the brightness can be seen approximately at the beginning and end of the published transit times.
Further Analysis
The measurement variability was reduced slightly by some tuning of the parameters used in IRIS and averaging of two duplicate sets of measurements on each image.
The downward drift may be due to reducing brightnesses during the run caused by increasing atmospheric extinction as the target elevation reduced. Although the brightness measurements are relative to the control star, non linearity in the camera is suspected of giving an over estimate of the relative brightness difference at lower brightness levels. The results have been corrected for this effect.
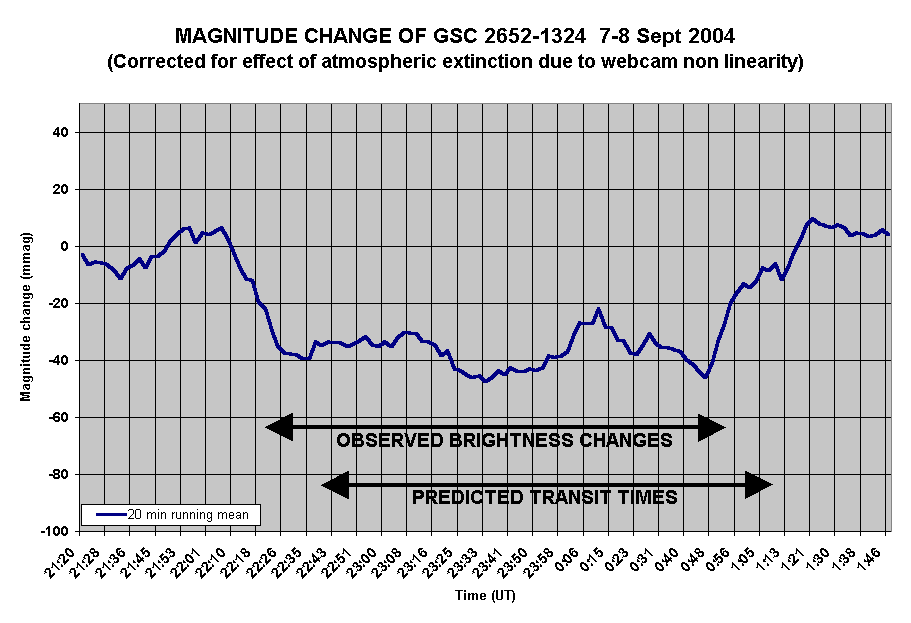
The length and magnitude of the transit (approx 150min and 0.03 mag) agree well with the
observations of others on 1st and 4th September but the timing appears to be approximately 15 min earlier than the ephemeris given at transitsearch. There is considerable uncertainty in the exact timing of the transit start and end however, since a 20 minute running mean was required to to see the drop in brightness during the transit clearly.
Analysis using a linear fit to 4 control stars
In an attempt to overcome the webcam non linearity problem directly, the magnitude of the target star has been recalculated using a linear fit to 4 control stars (marked A-D in the image). The results are plotted below.
(The average flux of the control stars over the run were measured. The flux of the control stars in each image was then plotted against these averages. This allowed a corrected flux to be estimated for the target star using a linear fit, which would tend to compensate for the effects of of atmospheric extinction due to webcam response non linearity, as seen for example in the original plot) The aperture photometry feature of IRIS software was used to measure the flux values of the stars in each image and Excel was used to calculate the linear fits.
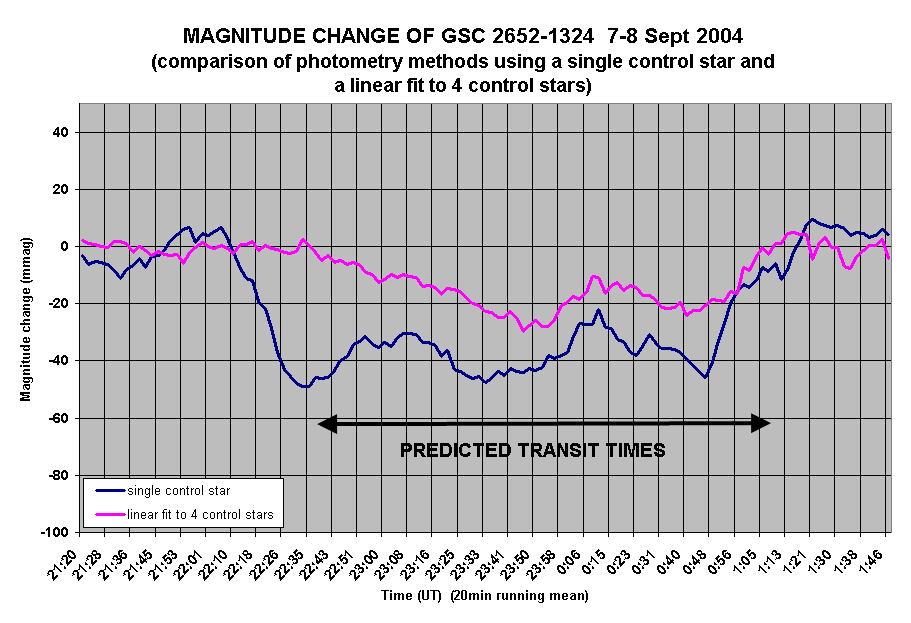
The results of this reduction technique look promising. The drift has been eliminated. A further effect of including more control stars is that there has been the significant change in the shape of the curve around the ingress, such that the start time is closer to that predicted, though the rate of brightness decrease is rather gradual. The estimated depth of the transit is less using this technique, (20mmag cf 35mmag) which is in better agreement with values reported eleswhere.
UPDATE 31 Dec 2004 - REPORTED ANOMALY IN EGRESS LIGHT CURVE
Pooled data from amateur and professional astronomers, coordinated by transitsearch and AAVSO, suggest an anomaly in the light curve at egress. See Sky and Telescope news article http://skyandtelescope.com/news/article_1419_1.asp and AAVSO Journal http://xxx.lanl.gov/PS_cache/astro-ph/pdf/0412/0412463.pdf which includes a reference to the data presented here.
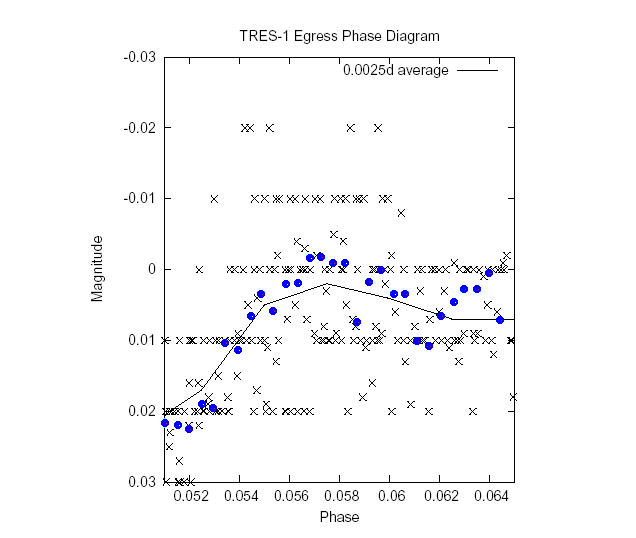
This graph (from the AAVSO paper) shows the pooled data and the anomaly, with the data from this study highlighted. There is some sign of the anomaly in the highlighted data, though it is only statistically significant in the pooled data.