In addition to changes in total absorption with time, the 7699A K I line profile shape also changes. Analysis of t hese changes suggests that there may be at least one ring of material beyond the outer edge of the eclipsing disc, separated from it by a gap. Evidence of this ring and gap is seen in the 7699A neutral Potassium absorption and there are signs of it as it first passes in front the star and then again when leaving it ~120 days later.
To quantify the changes in profile a series of zones , each 0.3A wide (11.5km RV) were defined across the line profile. (0.3A is approximately the resolution of the spectra) and the EW in each zone calculated for each spectrum. The pre eclipse contribution was subtracted and the resulting changes in EW with time were plotted for each RV zone. (The total EW for the line, less the pre eclipse component was also plotted)
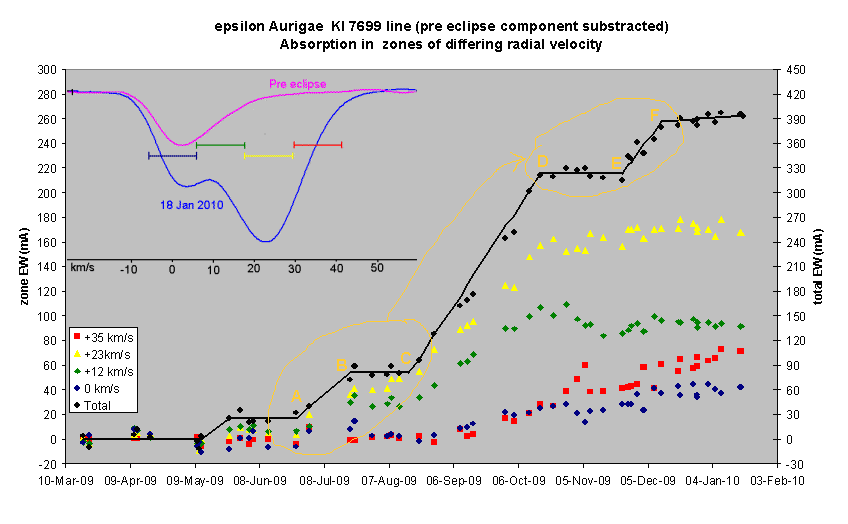
By plotting the change in absorption with time in different zones of the line profile, the absorption in parts of the eclipsing disc in front of the F star with differing radial velocity can be tracked.
T wo reasons why parts of the disc might show different RV are:
1) The geometric effect where the radial velocity observed varies around the disc depending on the component of the rotation in the direction of the line of sight. (The RV of an annulus seen edge on initially equals the rotation velocity, reducing to zero as the eclipse progresses and the rotation of the parts of the annulus in front of the star become tangential to our line of sight)
2) Decreasing rotation velocity within the disc with increased distance from the centre of the disc, assuming Keplerian motion.
A complete modeling of the system would be required to interpret the data quantitatively but various features in the variation in RV with time can be identified based on these effects.
The eclipsing object is initially seen in the +12 and +23 km/s RV zones . (CBET 1885 reporting the eclipsing object to be visible in the spectrum was issued based on these data at point A. The first c hanges in brightness were seen at point C)
From approximately point C onwards, the absorption in the lower velocity 0 km/s RV sector starts to increase. This is to be be expected as an increasing proportion of the disc in front of the star becomes progressively more tangential to our line of sight .
The higher velocity +35 km/s RV sector then starts to show increasing absorption. This can be interpreted as inner, faster rotating parts of the disc moving in front of the star.
At Point D, the leading edge of the disc which first moved in front of the star at point A reaches the far edge of the star 120 days later. At this point a flattening of the +12km/s and 23km/s absorption trends is seen as the part of the disc rotating at this velocity starts leaving the far edge of the star. This material is replaced by faster rotating inner parts of the disc moving onto the the star, producing a continuing rise in the faster +35km/s component.
The features from A-C (a rapid increase in absorption followed by a period of no change) could be interpreted as a gap in the disc, creating a separate outer ring. The period B-C when the absorption remained constant would be when the gap between the ring and the disc was moving into position in front of the star.
These features would then appear reversed at D-F as the outer ring and gap moved off the far edge of the star. Particularly striking is the way the +12km/s absorption drops rapidly a the time that the proposed outer ring, (rotating at this relatively slow velocity) would be leaving the star. The trend then levels off as expected as the gap leaves the star.