SPECTROSCOPY
Recurrent
Nova RS Ophiuchus
Outburst
2006
RETURN TO SPECTROSCOPY INTRODUCTION
Other amateur spectra of this object:
|
Evolution of RS Oph Spectrum |
|
|
|
|
|
Vmag (AAVSO) 11.8 |
8th
September Star Analyser 100 l/mm grating VC200L SC3 modified webcam RS Oph has now faded to Vmag 11.8. A reduction in dispersion was needed to
maintain a reasonable signal/noise. The Ha emission line has faded but
is still evident. The Fe X and other coronal lines have disappeared. There appears
to have been a shift in the continuum towards the red. |
|
Vmag (AAVSO) 10.1 |
22
April Star Analyser 100 l/mm grating VC200L SC3 modified webcam The low ionisation level emission lines (H, He, FeII) have now started to fade relative to the continuum. The high ionisation level 'coronal lines' are still present with several more lines indentified using this reference from the 1985 outburst. Click on the graph for a comparison between this spectrum and one from the 1985 outburst from this paper. |
|
Vmag (AAVSO) 9.5 |
21st
March Star Analyser 100 l/mm grating VC200L SC3 modified webcam A tentative identification of the lines has been made based on the following papers from the 1958 and 1985 outbursts. Since 4th March, a new line has appeared at 6365A. This is suspected to be the coronal line from Fe X caused by the high temperatures and which appeared at about this time in previous outbursts. It seems to be slightly blue shifted from its rest wavelength of 6374A |
|
Vmag (AAVSO) 8.4 |
4th
March Little change in relative intensities of features compared with 28th February |
|
Vmag (AAVSO) 8.0 |
28th
February The H alpha line intensity has increased significantly relative to the continuum spectrum. The star now appears red visually compared with straw colour on 18/19th Feb |
|
Vmag (AAVSO) 6.9 |
19th
February Star Analyser 100 l/mm grating VC200L SC3 modified webcam Conditions were good so the dispersion was increased by increasing the grating/CCD distance. Spectrum corrected for instrument response. See here for more information The y scale has been increased for the red spectrum to show the continuum detail |
|
Vmag (AAVSO) 6.6 |
18th
February Star Analyser 100 l/mm grating VC200L SC3 modified webcam Spectrum calibrated for wavelength and instrument spectral response using Gamma Oph (A0v) The intense H alpha emission line is clear, plus H beta, gamma, delta. Other emission lines are also visible, including one in the IR at 8450A. The feature at 7600A is due to atmospheric absorption. The base spectrum is flat with a slight increase towards the IR end of the spectrum up to 8500A. |
|
|
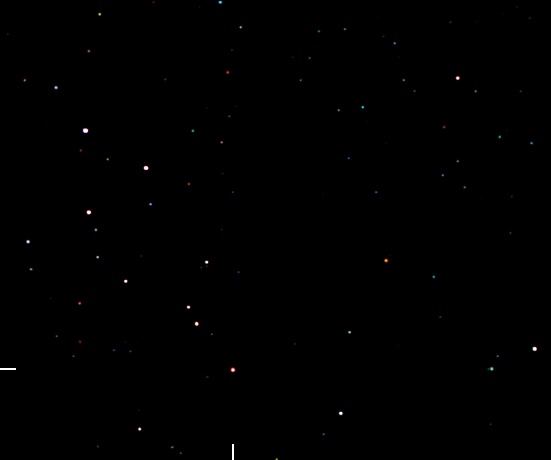
This wide field image (approximately 7 degrees) was taken using a 29mm SLR lens and the SC3 webcam with IR blocking filter and photographic RGB filters. The red colour of the Nova from the H alpha emission is evident. The reported visual magnitude at the time was +6.6 but this does not include the H alpha emission as the eye is not very sensitive to this wavelength. The Nova would not be visible in this image in its quisecent state. |
RETURN TO SPECTROSCOPY INTRODUCTION