The latest observations are here
7th December 2009 update - The long pause in KI line absorption is over
The KI 7699 line started increasing in intensity again from 26th November after a pause of ~ 40 days. Is this evidence of a gap in an eclipsing disc as postulated by Ferluga? Epsilon Aurigae. I - Multi-ring structure of the eclipsing body S. Ferluga Astronomy and Astrophysics, vol. 238, no. 1-2, Nov. 1990, p. 270-278
4th November update 2009 - Ingress phase
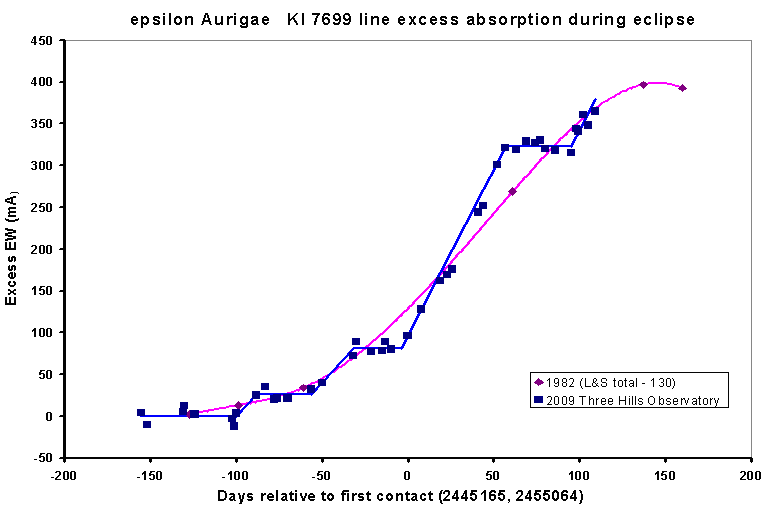
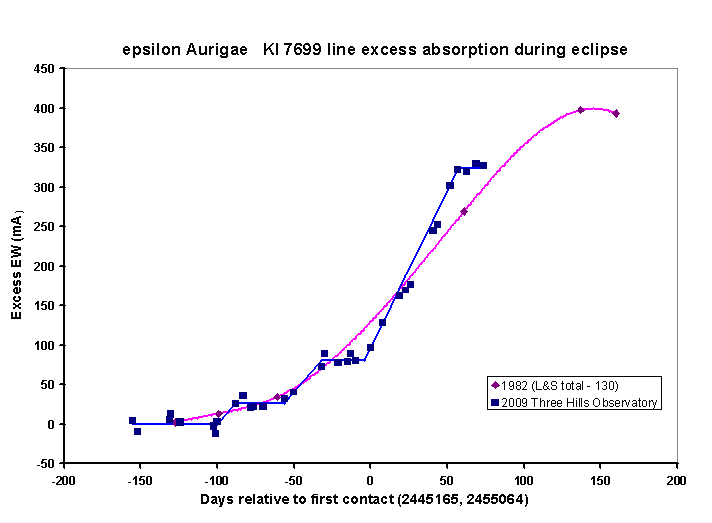
Ingress began photometrically around 20th August. At the same time, the excess absorption in the KI 7699 line started increasing again after a period of no change. The excess absorption kept increasing in line with the dropping brightness until mid October when the rate of increase again reduced considerably and may currently have stopped.
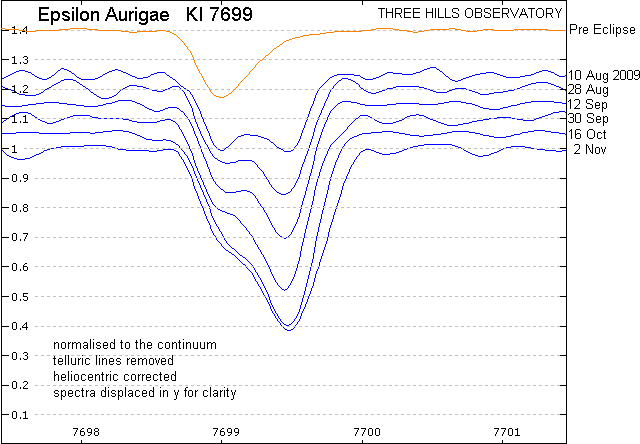
A selection of spectra showing development of the KI 7699 line since photometric first contact
There are clear differences in the rate of development of the KI 7699 line during ingress compared with what was seen by Lamber and Sawyer last eclipse
5th September 2009 "Have we reached 1st contact yet?"
As I write at the beginning of September there are discussions over whether the light curve shows the start of the eclipse yet. It seemed a good opportunity to review my data to date so I prepared a poster paper which I presented at a British Astronomical Association meeting in Leeds UK. It can be downloaded from this page.
Evolution of KI 7699 line to 21st August 2009
The red shifted absorption line component has been deepening gradually during the past month. There is no decrease in brightness reported yet
H gamma region 12th Aug 2009
first signs of the secondary at this wavelength (shell spectrum)
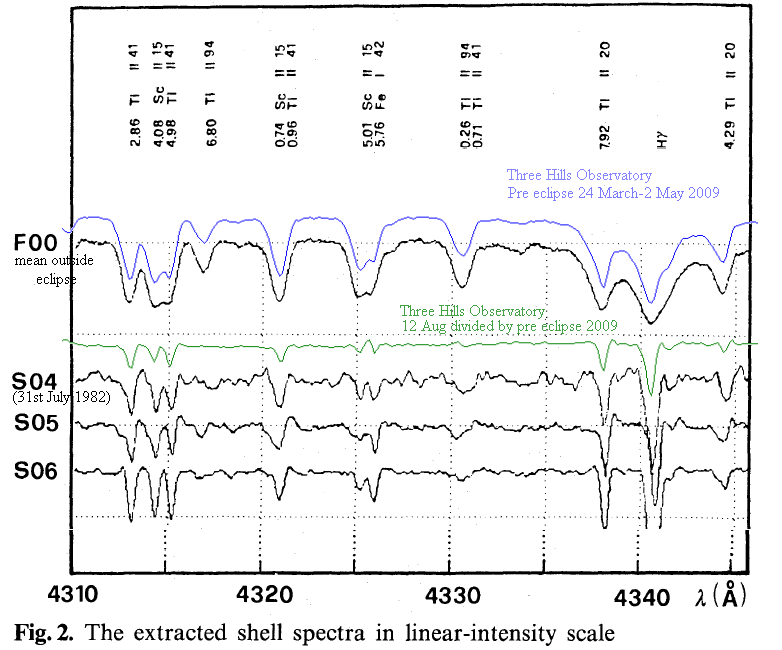
The figure (black) covers the ingress during last eclipse - Ferluga and Mangiacapra, Astronomy and Astrophysics (ISSN 0004-6361), vol. 243, no. 1, March 1991, p. 230-238 I have overlaid my results from this eclipse.
It shows the change in the spectrum seen by Ferluga last eclipse at ingress A04-S06 compared with F00 the spectrum outside eclipse. The coloured graphs are my data from this eclipse overlaid. The additional narrow absorption lines only appear immediately before during and after the eclipse.
Evolution of KI 7699 line up to 5th Aug 2009
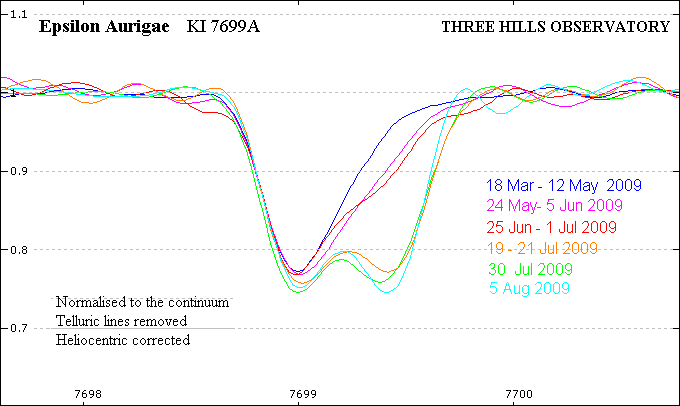
After the large change in the line profile between 1st and 19th July, there has been little further development of the new redshifted component up to 5th August
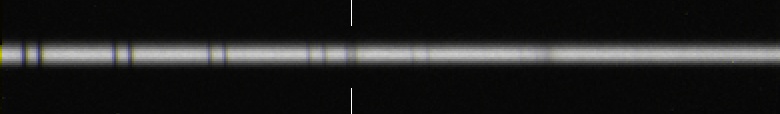
In case you were wondering, this is what the spectrum actually looks like before digitising it as a graph. You can just see the two components in the KI line (The wider spaced pairs of lines are produced by oxygen molecules in our atmosphere)
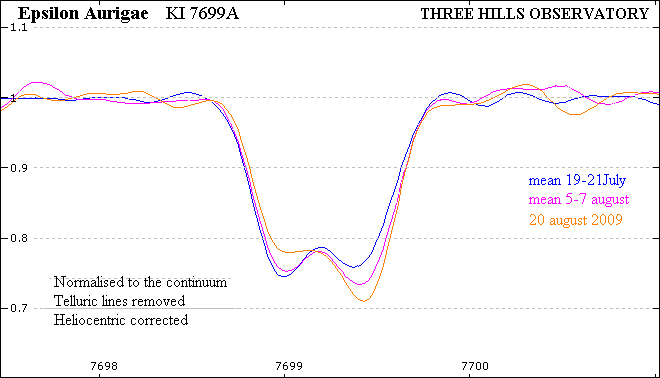
Confirming observation 21st July 2009 of eclipsing object component in KI 7699 line
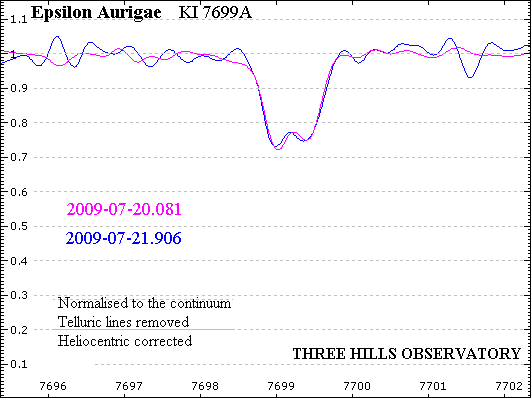
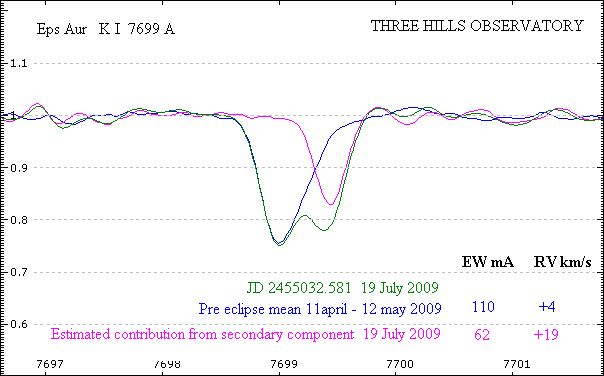
KI 7669 A line - Estimation of contribution from eclipsing object 19 July 2009
This observation is now published in CBET 1885 (subscription required) or read the text here on citizensky.org
KI line evolution April-July 2009 on approach to first contact
As of 19th July, the contribution to the 7699 KI absorption line from the secondary is now obvious, redshifted 19km/sec
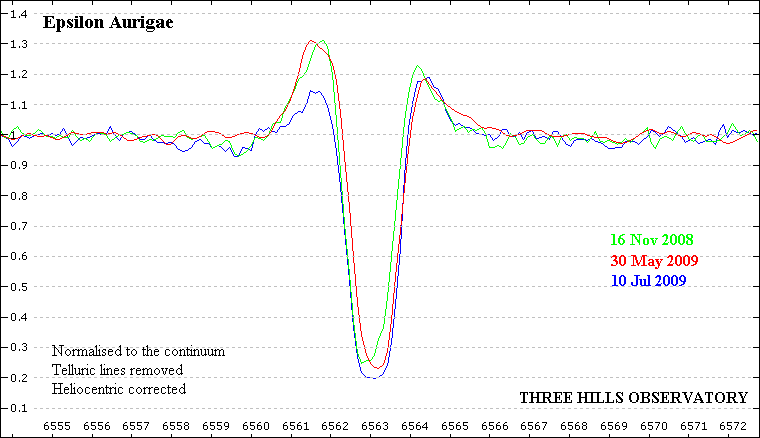
Changes in H alpha profile May/July 2009 on approach to first contact
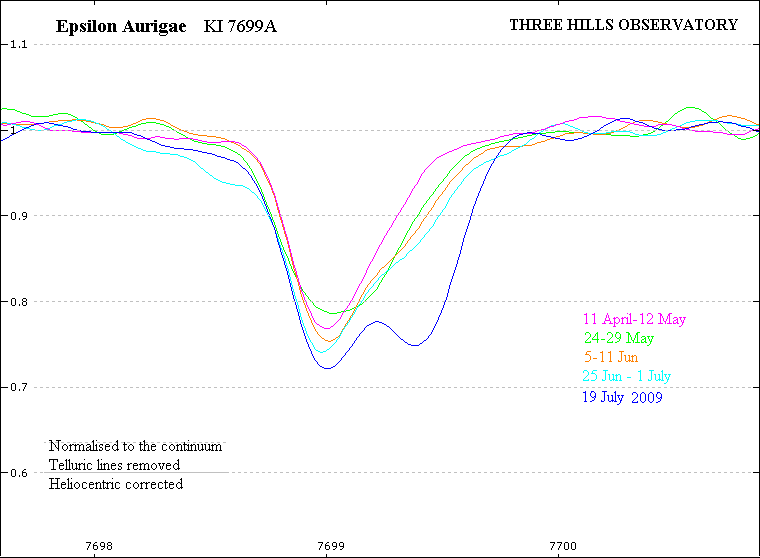
Evolution of KI line profile
May/June
2009
compared with previous
eclipse
There is evidence of a broadening on the red edge of the KI line profile in results from 24,29 May 2009. This may be the first indication of the start of the ingress phase. The line has broadened further slightly during June
Pre Eclipse Variations May 2009 (H gamma region)
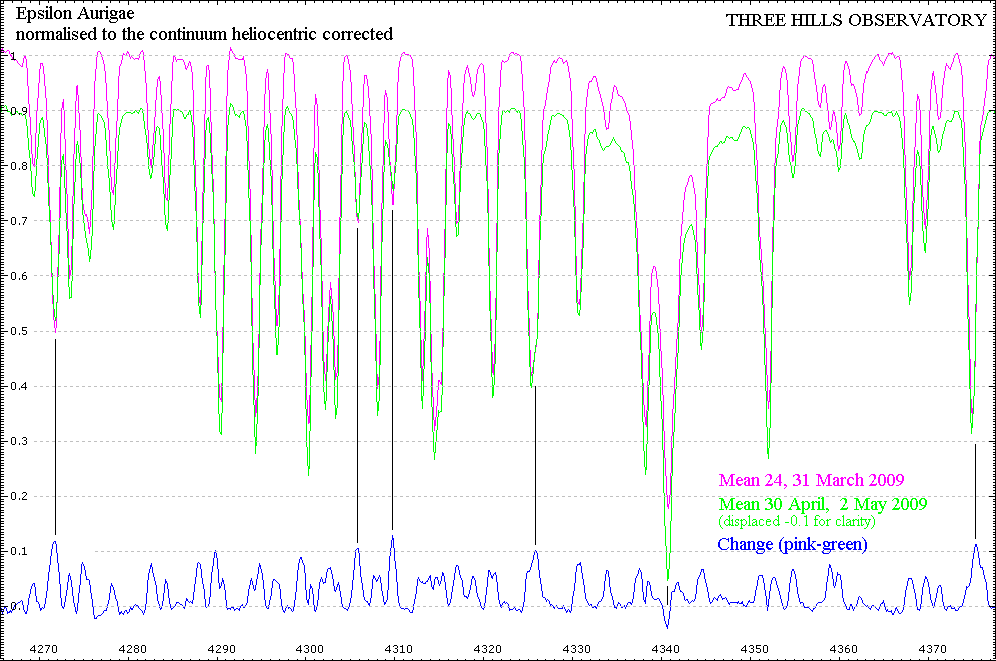
The intensity of many of the metal absorption lines in the H gamma region have reduced by a few percent from March to May 2009. The core of the H gamma absorption line however has increased in depth slightly. These changes are most likely due to changes in the FO star rather than the eclipsing object.
Pre Eclipse Variations May 2009 (KI region)
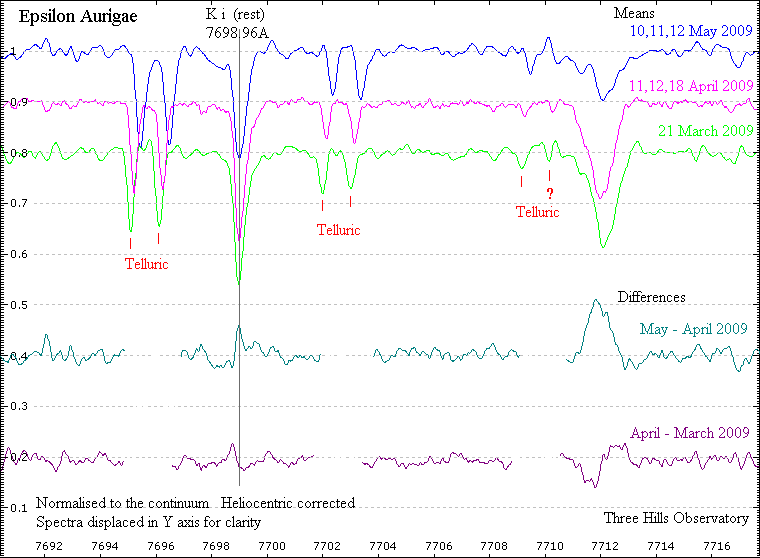
There have been small variations in the intensity of the KI line. The broad line at 7712A (Fe II multiplet) however reduced significantly from April to May 2009. This line is sensitive to variations in circumstellar material (as seen in Be stars for example).
Comparison of KI line profile with previous eclipse
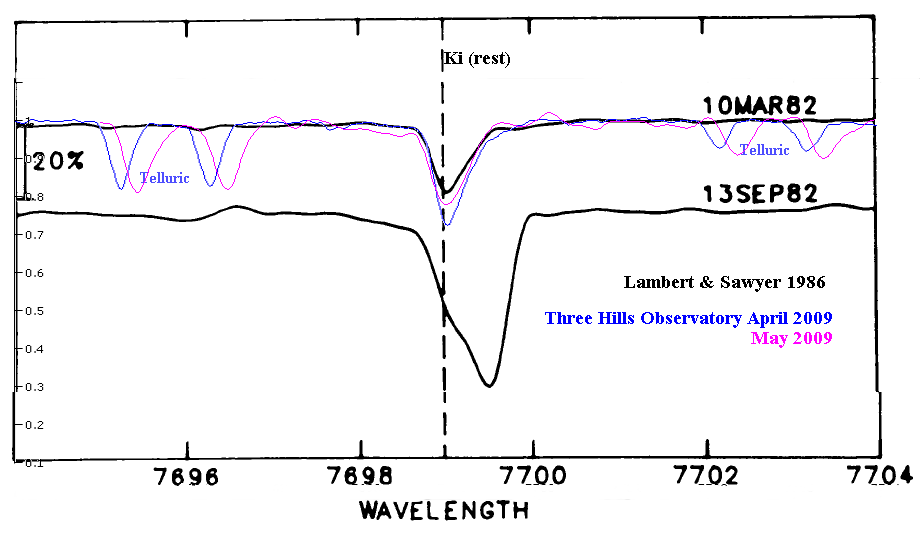
The KI line results have been overlaid on results from the beginning of the previous eclipse. (Epsilon Aurigae in eclipse. II - Optical absorption lines from the secondary Lambert, D. L.; Sawyer, S. R Astronomical Society of the Pacific, Publications, vol. 98, April 1986, p. 389-402)
The line profile April /May 2009 is similar to that seen pre 1982 eclipse, but with a somewhat increased intensity.
Pre Eclipse
Spectra Feb 2008-Mar
2009
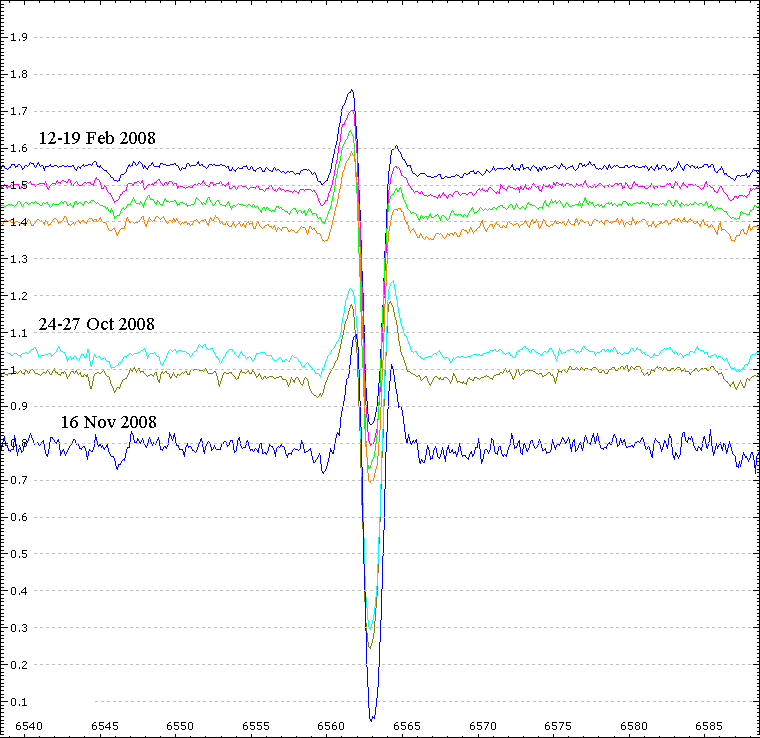
Hydrogen Alpha region LHIRES III at
R~17000
Hydrogen Gamma region LHIRES III at
R~12000
K I line LHIRES III R~22000