SPECTROSCOPY
Epsilon Aurigae Eclipse Campaign
2009-2011 (Post eclipse
update 19th January
2013)
Earlier observations are archived here
The International Campaign archive of amateur spectra is maintained here
The last lingering signs of the eclipsing object in the spectrum finally disappeared into the noise early in 2012. Two papers using the Three Hills Observatory data have been published in JAAVSO volume 40 part 2 which focussed on epsilon Aurigae. They can also be found on Arxiv here:-
Ha spectral monitoring of epsilon Aurigæ 2009-2011 eclipse
Recording Epsilon Aurigae at minimum angular separation from the Sun 7th June 2009
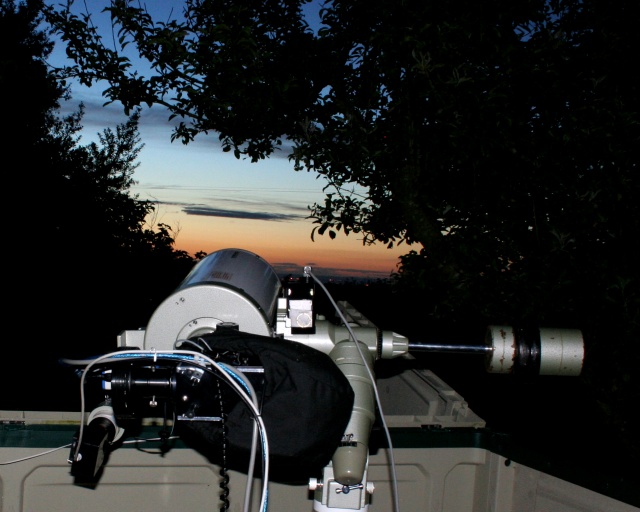
Every 27 years Epsilon Aurigae is eclipsed by a strange extended
object, the exact nature of which is poorly understood.
The eclipse 2009-2011
will be
closely studied by amateurs
and
professionals alike. In
particular it will be the
first
time that amateurs
equipped
with
high
resolution
spectrographs
will be able to
contribute. I will be posting some of the
spectra
I record
during the
campaign on
this
page. If you fancy trying spectroscopy for the first time click
here for a simple way to record a low resolution
spectrum of Epsilon Aurigae
using a
digital SLR camera Follow
these
links
for
further
information on Eps
Aur and the
2009-2011
eclipse
campaign
AAVSO
Variable Star of the
Month Citizen Sky
Project
Jeff
Hopkin's Campaign
page
Rob
Stencel's
Campaign
page
BAA VSS
page
This page contains my most recent
observations. Earlier observations are archived here
The International Campaign archive of
amateur spectra is here ---------------------------------------------------------------------------------------------------- Update 16 October 2011 - The KI 7699 line
post 4th photometric contact Although the eclipse ended photometrically in
May
2011, the extended
atmosphere of
the
eclipsing
object
continues to
be visible in
the
spectrum. Animation (.wmv movie) showing the evolution
of the K I 7699A line (outside eclipse component removed)
from March 2009 to
October
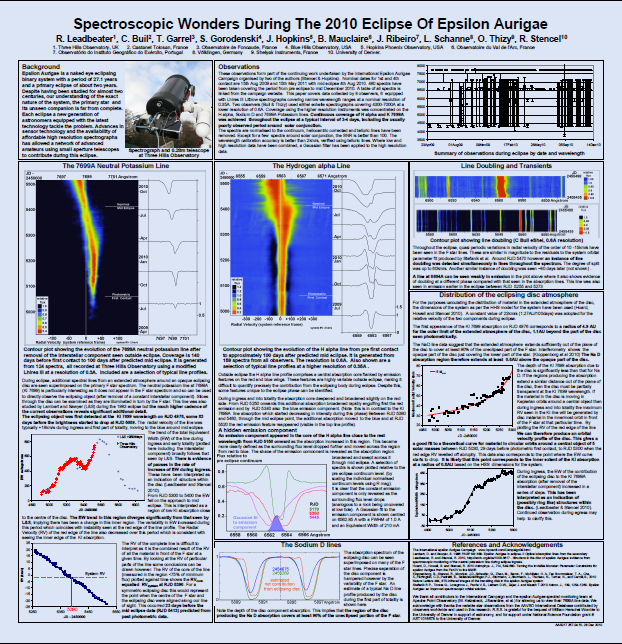
2011 Update January 2011 - 217th American
Astronomical
Society meeting,
Seattle The AAS 217 Seattle
meeting included oral and poster sessions on epslion
Aurigae. The poster below was presented covering the
amateur
spectroscopic
observations
to
date. Click to download the poster in original or multi-page A4 formats
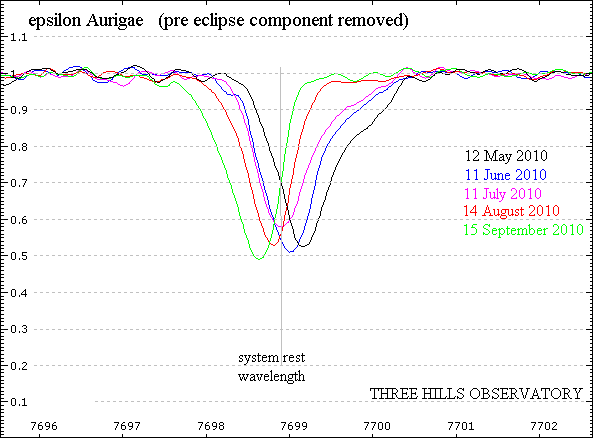
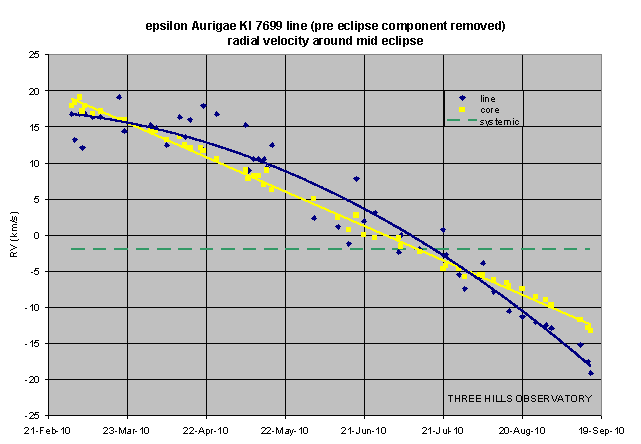
Update 20 September 2010 - The KI
7699 line at mid eclipse Based on past photometric data, mid eclipse from was predicted to
be 4th August 2010. If the system was perfectly symmetric,
this
would
be
the
date
when
the
F
star and
the
centre
of
the
eclipsing disc
would lie
directly
along our
line of
sight and
the radial
velocity (RV)
of both
components
would be
zero
relative
to the radial
velocity
of
the
complete
system (~
-2km/s
from
published
orbital
solutions) If
the
eclipsing
disc
disc is
symmetric we
should see equal
amounts of
material
with red
and blue radial
velocities
at mid eclipse so the KI
absorption
line (after removal of
the
interstellar component)
should
appear symmetric
about
the
system rest
wavelength. The line shifted from the red to the blue side around
mid/late July
2010. The line
profile appeared most
symmetric around 25th July
. By plotting the RV of the line we can
estimate when the RV of the eclipsing
body
matched
the system RV. For the
complete line this was
on
or
around 17th July,
though
the scatter
is large
due to
variations in the high
velocity
components in
the
wings. Measuring the RV of
the
narrow core
of the
line may give a more
accurate
indication (scatter
is very
low at typically +-1km/s)
This matched the
system
RV on or around 12th July. Note that the point where
the
two
lines
cross
(27th
July) is
the
point
when
the
line
is most
symmetric.
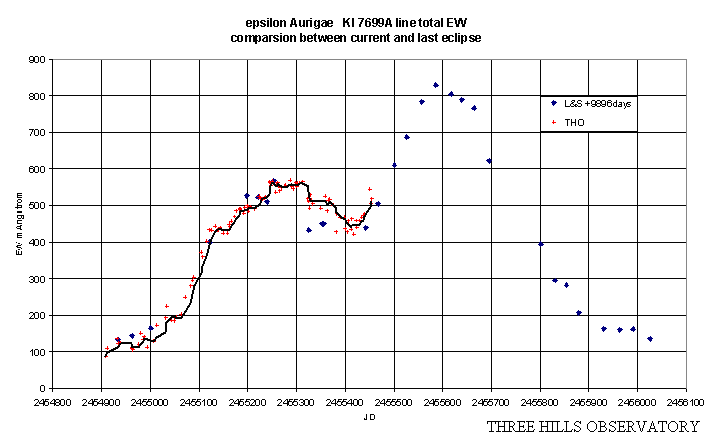
Comparing the total line strength (ie including the out of
eclipse component) with results from Lambert and
Sawyer last eclipse we see
that the
descent to the minimum
around mid
eclipse was more gradual during
this
eclipse.
The
strength is now
increasing again but perhaps delayed by ~15 days
compared
with last time. Update 8th May 2010 - The
KI 7699 line in full eclipse A paper based on these KI line spectra during ingress
has
been published on ArXiv
interpreting the changes
seen in the
line
intensity
and
profile
in
terms
of
ring
like
density
variations
in
the
eclipsing
disc. "Structure in the disc of epsilon Aurigae:
Spectroscopic
observations
of
neutral
Potassium
during
eclipse ingress"
Robin
Leadbeater, Robert
Stencel
arXiv:1003.3617v2
[astro-ph.SR] 18 March
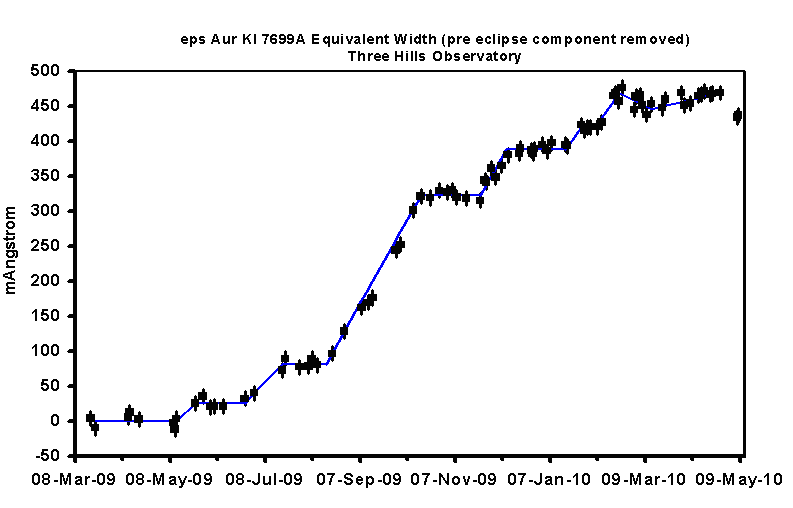
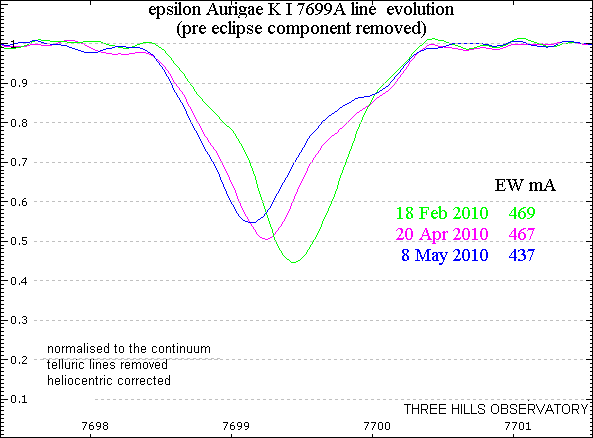
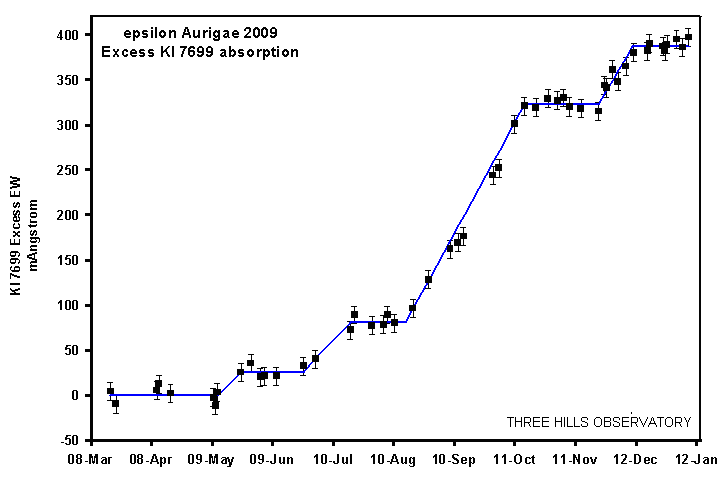
2010 The equivalent width of the KI 7699
line levelled off on 18th February 2010 but
the line
profile continued to
evolve with the core of the line
moving to the blue. Click here for an animations and false colour
plot showing the evolution of this
line. The latest observations
7th and
8th May show the line
intensity dropping
currently. 8th May 2010 is the
predicted date
for the start of
the
expected
mid
eclipse
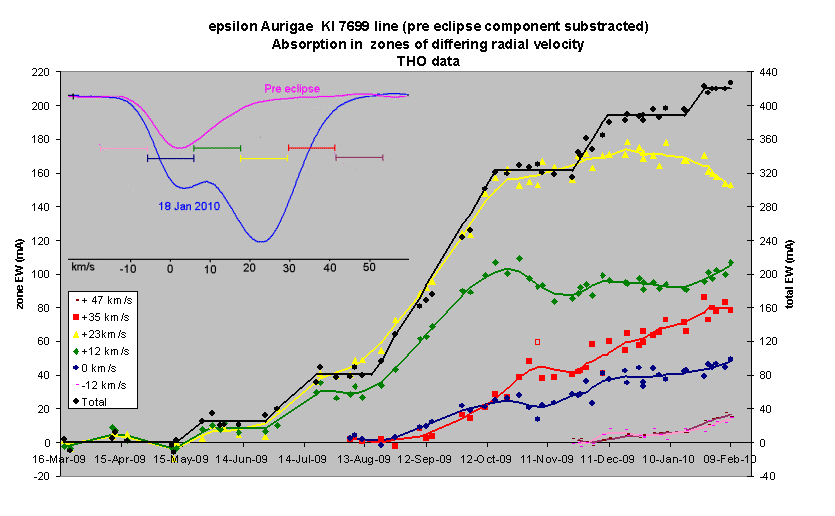
brightening. Update 14th February 2010 - Analysis of
variations in radial velocity in the K I 7699 line
profile The profile of the KI 7699 line during eclipse contains
information about the line of sight velocity in
different
parts
of
the
eclipsing
disc
.
Analysing
the
way the
profile changes
during
eclipse
could
potentially
provide
information
about
the
structure and
dynamics of the
eclipsing object. To
track these
profile
changes, the line
has
been
divided
into
a series
of
0.3A
wide
zones
(11.5km/s Radial V
elocity)
and
the Equivalent Widths in
each zone
calculated for
each
spectrum.
The pre
eclipse contribution was
subtracted
and
the
resulting
changes
in
EW with
time have
been plotted
for
each RV
zone. (The
total EW for the
line,
less the pre
eclipse
component is also
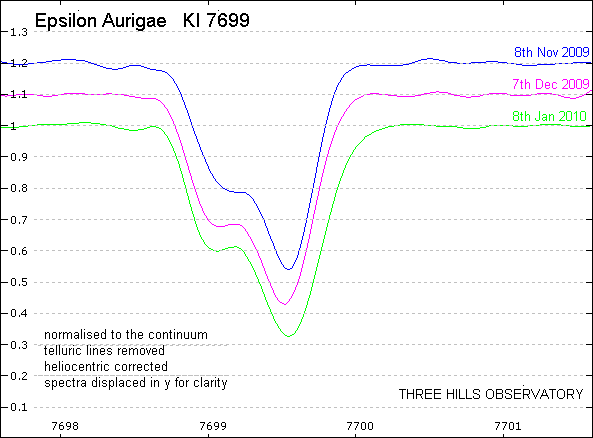
plotted) Update 16th January 2010 - Second
Contact Potassium 7699A
line Photometrically the light curve has flattened
off, indicating that the densest part of the
eclipsing
object now
stretches
across
the F
star and the second
contact
point of the eclipse has
been
reached.
The more
tenuous outer
regions of the
eclipsing
object however (as tracked for example
by the
additional absorption
in the K I 7699
line)
have
been
spread across the
width of
the
eclipsed star for some
months
now. As
a result, the
changes
in
the K I
7699
line have
become more subtle
since
November
2009.
Although
the
Equivalent
W
idth
has
continued
to
increase
overall,
the
changes
have
been more at the edges
of the
line profile
with
little increase in
the
maximum
absorption.
This may
be
explained if
the eclipsing
object
is
a
rotating disc in Keplerian motion.
a) As the eclipse progresses, an increasing proportion of the
rotating disc in front of the star is moving almost
transversely
relative to our line
of
sight and so
shows little doppler
shift due to the
rotation.
This produces
an
increase in
absorption
around
the
KI
rest
wavelength,
currently at the
blue edge of
the
absorption line
profile.
b)
The
inner
regions
of
the
leading
half
of the
disc
are now
moving
in
front
of
the
star.
These
are
rotating
faster
than
the
outer
regions
now moving off
the
far
edge
of
the
star
and the
net
result is an
increased radial velocity
red shift.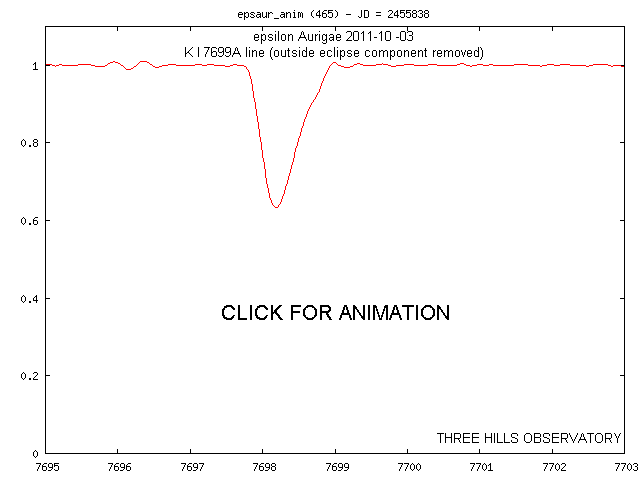
The intensity of the additional absorption in the KI 7699 line has now reached 400 mAngstrom equivalent width, similar to the value seen at this stage by Lambert and Sawyer during the previous eclipse.
KI 7699 EW data and line profiles from Three Hills Observatory were included in this poster paper presented at the 110th AAS meeting Washington DC January 2010.
The EW results were also included in this poster paper presented at the 25th New Mexico Symposium January 2010 as part of a collaboration with Apache Point Observatory
The THO results are in good agreement with those obtained using the 3.5m ARC telescope and ARCES spectrograph at APO as shown in fig 7 of the paper.
Hydrogen alpha 6563A line
Identifying changes in the Hydrogen alpha line due to the eclipse is complicated by variations seen in this line outside eclipse (both in the absorption core and in the red and blue emission wings).
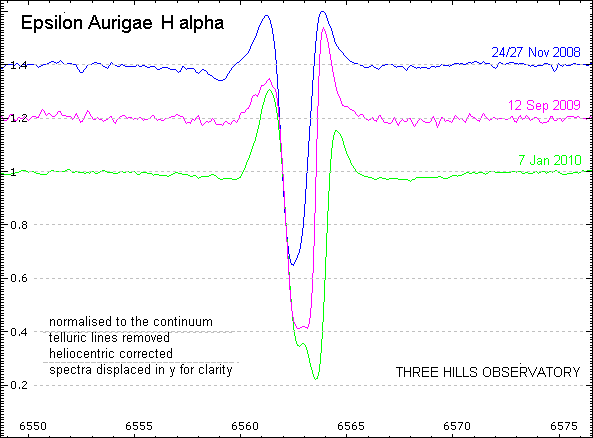
The emergence of an additional absorption component during ingress to the red of the out of eclipse absorption core is clear however.
H gamma and metal lines 4270-4370A
The "shell spectrum" of narrow metal lines, extracted by dividing the in eclipse spectra by the mean pre eclipse, was identified by Ferluga during the last eclipse and was first seen in THO spectra during this eclipse in August 2009
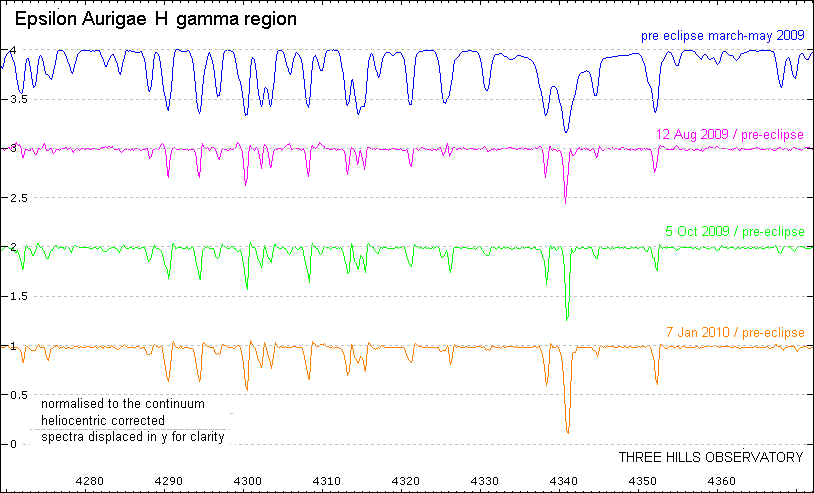
During ingress the H gamma line in the shell spectrum has increased significantly in intensity, the other features less so. Note also the absence in the shell spectrum of some lines present in the pre eclipe spectrum. The Ti II line at 4331A is a good example.
----------------------------------------------------------------------------------------------------
Earlier observations are archived here