SPECTROSCOPY
Epsilon Aurigae Eclipse Campaign
2009-2011
Animation of the KI 7699A line (Pre eclipse component removed) March 2009 - April 2010
Frames at 2 day intervals generated from 78 spectra taken at
irregular intervals using Rlhires and gnuplot
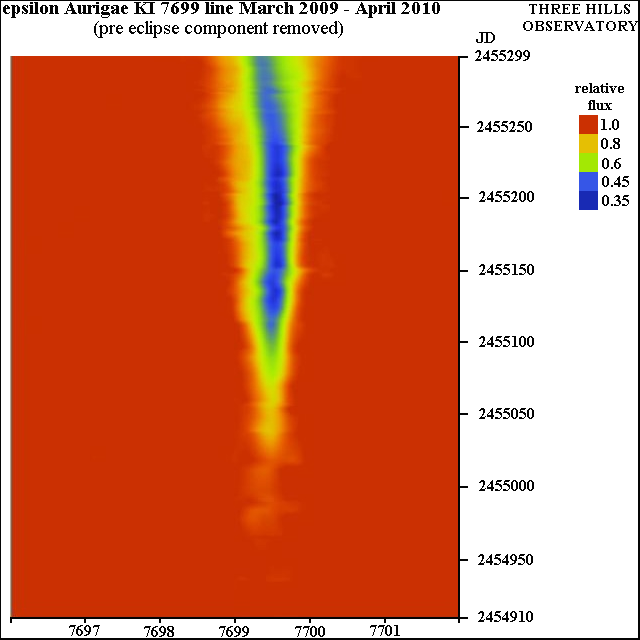
software False colour plot of KI 7699A line
evolution March 2009 - April 2010 Generated using Rlhires and IRIS software Note the broadening of the line throughout the period
and the change in direction in the shift of the line core
from red to blue
around 18th
February 2010 coinciding with
the time when the
excess
EW
levelled off.